The EUR/USD pair traded calmly in different directions on Tuesday. We warned about this yesterday—without a macroeconomic backdrop, market participants had no reason to make sudden moves. Let's also remind you that the euro is not like the British pound, which can rise under any circumstances or even without any at all. From the beginning of the year, we've been saying that the pound has incredible resistance to falling against the dollar. While the euro occasionally takes pauses, the pound does not.
However, the fact that the euro is standing still doesn't mean that the previous rise was logical or justified. All the factors pushing the pair upward remain the same. The only reports worth attention in the first two days were the business activity indices, which couldn't have influenced the market sentiment in advance. These reports showed that the European economy, which has already been stalling over the last two years, might slow down even further. If the previous quarter recorded growth of a "whopping" 0.2%—which many experts label as a "recovery"—the next quarter might see zero growth. However, in the context of the European Union, few are talking about a recession. Why would they? Discussions about a recession have to be somehow reflected in the charts. In America, for example, everyone has been expecting a recession for a year and a half, while the economy showed 3% growth in the second quarter, yet everyone is still waiting for a recession. This partly explains the dollar's decline. We'd have to sell the euro if we expect a recession in the EU.
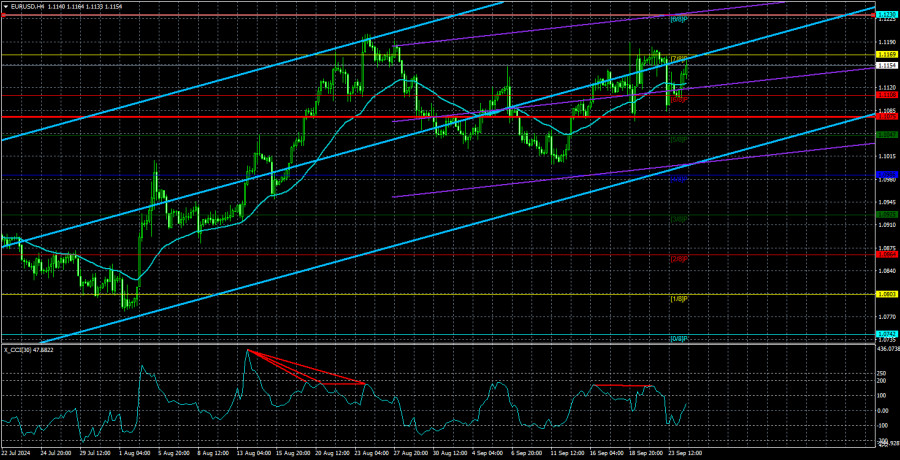
The fact that the euro failed to break through the latest local high last week might warn us that the pause will not only be on the 4-hour time frame. In other words, the correction that began on August 26 but quickly ended could resume. Let's recall that the market had an excellent opportunity to sell the dollar last week when the Federal Reserve eased its monetary policy by 0.5%. The market might anticipate further easing, with a 0.5% rate cut in November. What would stop it from doing so? No one seems to be talking about the European Central Bank right now, even though the ECB has cumulatively lowered the rate just as much as the Fed. Yes, by the end of the year, the Fed's rate could drop by another 0.75%, while the ECB's rate will likely drop by no more than 0.25%. But the euro has been rising continuously, at least since July! So, the market has already started pricing in advance in the divergence in rates between the ECB and the Fed.
We still cannot predict further growth for the euro, as there is no logic or foundation for it. The pair might continue to rise for some time due to momentum, as it seems unwilling to fall. In the near future, we expect a return to the 1.1000 level or even a bit lower—at the very least. At most, a new downward trend should begin.
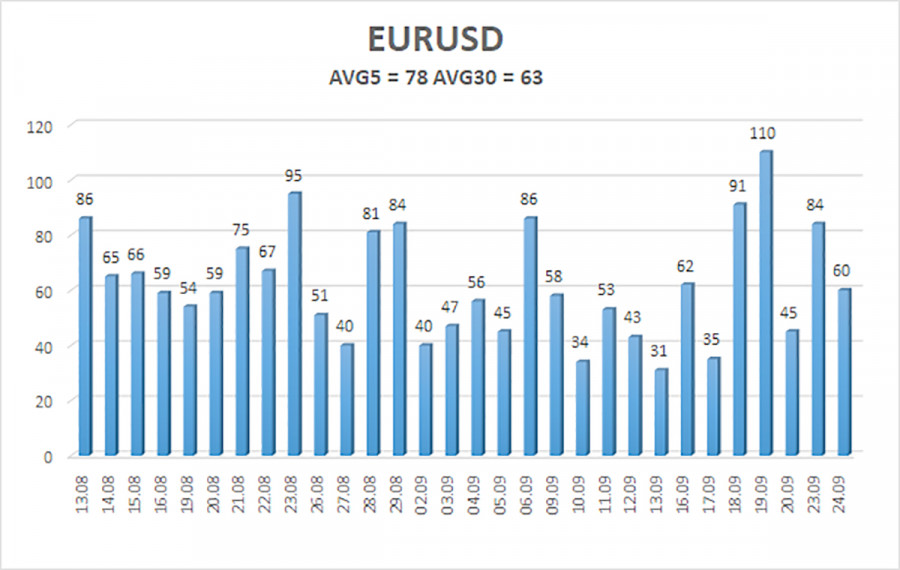
The average volatility of the EUR/USD pair over the last five trading days as of September 25 is 78 pips, which is characterized as "average." We expect the pair to move between the levels of 1.1075 and 1.1231 on Wednesday. The upper linear regression channel is directed upwards, but the overall downtrend remains. The CCI indicator entered the overbought area three times, warning of a possible trend reversal to a downward movement and signaling the complete illogicality of the recent growth. However, we only observed a relatively weak correction.
Nearest support levels:
S1 – 1.1108
S2 – 1.1047
S3 – 1.0986
Nearest resistance levels:
R1 – 1.1169
R2 – 1.1230
R3 – 1.1292
Trading Recommendations:
The EUR/USD pair has resumed upward movement, although it hasn't yet broken the last local high. In recent reviews, we mentioned that we expect only a decline in the euro in the medium term since the new growth seems almost like mockery. There's a possibility that the market has already priced in all or virtually all the future rate cuts by the Fed. If that's the case, the dollar has no more reasons to fall. Short positions can be considered if the price consolidates below the moving average, with targets at 1.0986 and 1.0925. If you trade based on "pure" technical analysis, then long positions remain relevant above the moving average line.
Explanations for Illustrations:
Linear Regression Channels: These help determine the current trend. If both point in the same direction, the trend is currently strong.
Moving Average Line (settings 20,0, smoothed): It defines the short-term trend and the direction in which trading should currently be conducted.
Murray Levels: Target levels for movements and corrections.
Volatility Levels (red lines): The likely price channel in which the pair will spend the next 24 hours, based on current volatility indicators.
CCI Indicator: Its entry into the oversold area (below -250) or the overbought area (above +250) indicates that a trend reversal in the opposite direction is approaching.


