Analyzing Monday's trades:
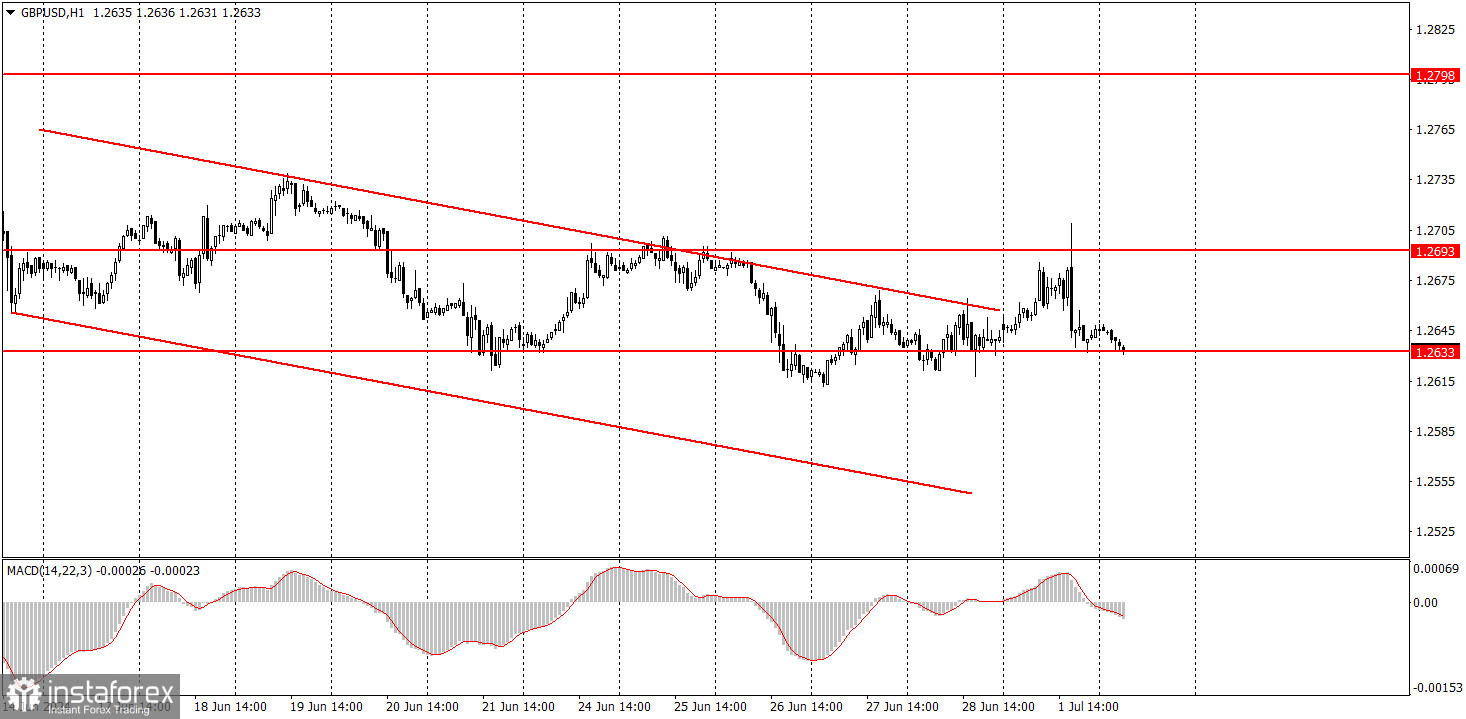
GBP/USD on 1H chart
GBP/USD also showed positive trades in the first half of the day, which certainly could not have been triggered by the election results in France, as they have no relevance to the UK or the British pound. However, the GBP/USD pair, like the EUR/USD pair, has been trading sideways for the past two weeks. Therefore, another wave of growth within the flat trend didn't need any specific reasons or justifications. Throughout the day, the price stayed between the levels of 1.2633 and 1.2693. Volatility was slightly higher than usual. There were macroeconomic events throughout the day, but the market practically ignored them.
Among the macroeconomic events, we can highlight the US ISM Manufacturing Index. The dollar grew in the second half of the day even if the report showed disappointing values. Therefore, once again the pair showed inconsistent and groundless movements. However, let us remind you that logical movements are quite rare in a flat market.
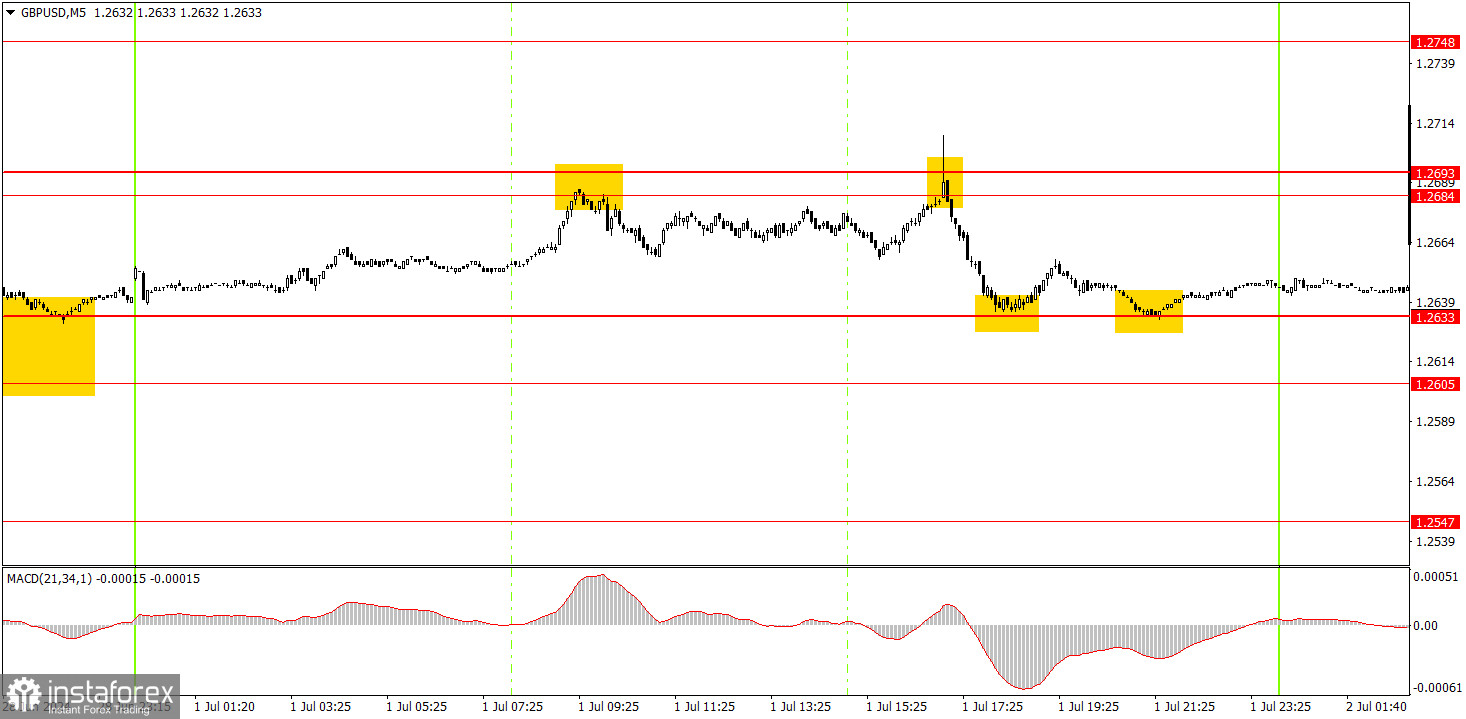
GBP/USD on 5M chart
The pair generated two trading signals on the 5-minute timeframe. On Friday, the price rebounded from the area of 1.2605-1.2633, but we usually avoid trading signals that carry over to the next week. On Monday, the price rebounded from the area of 1.2684-1.2693 twice, so novice traders could open a short position. During the US session, the price reached the nearest target level of 1.2633. The profit from the trade was about 35 pips. Two rebounds from the level of 1.2633 suggest that the pair may rise today.
Trading tips on Tuesday:
On the hourly chart, GBP/USD continues to show promising signs of forming a downtrend, but this doesn't mean that the pair can't form an upward trend. In regards to the bearish prospects, it's a good thing that the price managed to overcome the 1.2693 level twice; However, the market often refuses to sell, even in the presence of technical, fundamental, and macroeconomic factors favoring such a direction. Lately the pair has mainly moved sideways. The price has left the descending channel.
Today, the British pound may continue to exhibit erratic and illogical movements. Fortunately, the pair may start to show stronger movements as this week's economic calendars include a significant amount of important data, but Monday has shown that we shouldn't count on extremely strong movements.
The key levels on the 5M chart are 1.2457, 1.2502, 1.2541-1.2547, 1.2605-1.2633, 1.2684-1.2693, 1.2748, 1.2791 -1.2798, 1.2848-1.2860, 1.2913, 1.2980. There are no important events or reports scheduled in the UK. On the other hand, the US docket will feature Federal Reserve Chairman Jerome Powell's speech and the JOLTs report in May.
Basic trading rules:
1) Signal strength is determined by the time taken for its formation (either a bounce or level breach). A shorter formation time indicates a stronger signal.
2) If two or more trades around a certain level are initiated based on false signals, subsequent signals from that level should be disregarded.
3) In a flat market, any currency pair can produce multiple false signals or none at all. In any case, the flat trend is not the best condition for trading.
4) Trading activities are confined between the onset of the European session and mid-way through the U.S. session, after which all open trades should be manually closed.
5) On the 30-minute timeframe, trades based on MACD signals are only advisable amidst substantial volatility and an established trend, confirmed either by a trendline or trend channel.
6) If two levels lie closely together (ranging from 5 to 15 pips apart), they should be considered as a support or resistance zone.
How to read charts:
Support and Resistance price levels can serve as targets when buying or selling. You can place Take Profit levels near them.
Red lines represent channels or trend lines, depicting the current market trend and indicating the preferable trading direction.
The MACD(14,22,3) indicator, encompassing both the histogram and signal line, acts as an auxiliary tool and can also be used as a signal source.
Significant speeches and reports (always noted in the news calendar) can profoundly influence the price dynamics. Hence, trading during their release calls for heightened caution. It may be reasonable to exit the market to prevent abrupt price reversals against the prevailing trend.
Beginners should always remember that not every trade will yield profit. Establishing a clear strategy coupled with sound money management is the cornerstone of sustained trading success.