signal strength 3 of 5

The Bearish pennant pattern has formed on the EURJPY M30 chart. It signals potential continuation of the existing trend. Specifications: the pattern’s bottom has the coordinate of 162.05; the projection of the flagpole height is equal to 88 pips. In case the price breaks out the pattern’s bottom of 162.05, the downtrend is expected to continue for further level 161.75.
Juga lihat
- All
- Double Top
- Flag
- Head and Shoulders
- Pennant
- Rectangle
- Triangle
- Triple top
- All
- #AAPL
- #AMZN
- #Bitcoin
- #EBAY
- #FB
- #GOOG
- #INTC
- #KO
- #MA
- #MCD
- #MSFT
- #NTDOY
- #PEP
- #TSLA
- #TWTR
- AUDCAD
- AUDCHF
- AUDJPY
- AUDUSD
- EURCAD
- EURCHF
- EURGBP
- EURJPY
- EURNZD
- EURRUB
- EURUSD
- GBPAUD
- GBPCHF
- GBPJPY
- GBPUSD
- GOLD
- NZDCAD
- NZDCHF
- NZDJPY
- NZDUSD
- SILVER
- USDCAD
- USDCHF
- USDJPY
- USDRUB
- All
- M5
- M15
- M30
- H1
- D1
- All
- Buy
- Sale
- All
- 1
- 2
- 3
- 4
- 5

The Triple Bottom pattern has formed on the chart of the NZDCAD M5 trading instrument. The pattern signals a change in the trend from downwards to upwards in the case
The M5 and M15 time frames may have more false entry points.
Open chart in a new window
The Triple Bottom pattern has been formed on NZDJPY M15. It has the following characteristics: resistance level 84.49/84.47; support level 84.31/84.32; the width is 18 points. In the event
The M5 and M15 time frames may have more false entry points.
Open chart in a new window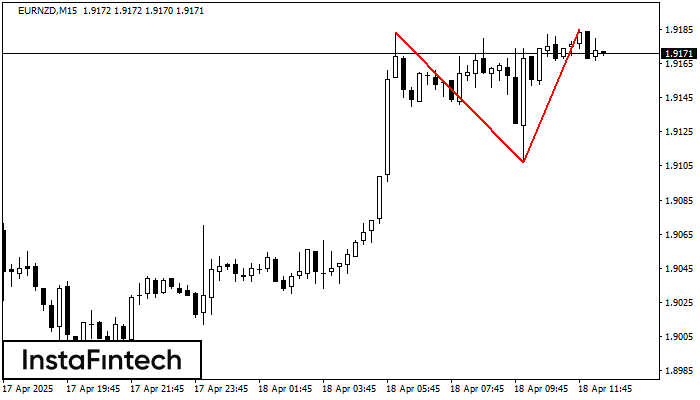
The Double Top reversal pattern has been formed on EURNZD M15. Characteristics: the upper boundary 1.9183; the lower boundary 1.9107; the width of the pattern is 78 points. Sell trades
The M5 and M15 time frames may have more false entry points.
Open chart in a new window