empty
18.12.2024 08:34 AM
How to Trade the EUR/USD Pair on December 18? Simple Tips and Trade Analysis for Beginners

Analysis of Tuesday's Trades

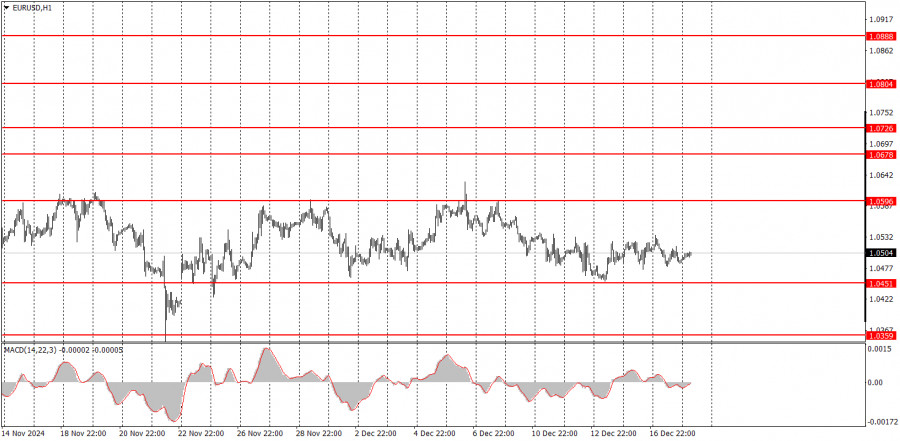
1H Chart of EUR/USD

This image is no longer relevant

On Tuesday, the EUR/USD pair continued trading within a clear sideways channel. Neither macroeconomic nor fundamental factors can break the pair out of this flat range. We previously warned that a correction could take a long time, as this is standard market behavior. Corrections are often used to accumulate new positions, and we believe that the current phase involves building up short positions on the euro. Until the flat ends, no clear direction in movement can be discussed. Flat trading is always chaotic and random.

Yesterday, the Eurozone released several secondary reports that did not impact the pair's movement. In the U.S., reports on industrial production and retail sales were published. The first report showed weaker-than-expected results, while the second exceeded forecasts. As expected, the flat movement continued.

5M Chart of EUR/USD

This image is no longer relevant

Only one signal was formed on Tuesday in the 5-minute timeframe. There was a bounce from the 1.0526 level overnight, but the price hadn't moved far from the signal's formation point by the time the European trading session opened. The pair failed to reach the nearest target level of 1.0451, but novice traders had numerous opportunities throughout the day to close the trade with profit.

Trading Strategy for Wednesday:

On the hourly timeframe, EUR/USD continues to correct within the sideways channel of 1.0451–1.0596. After a two-month decline, no one is rushing to buy the euro. This week, the price may break out of this channel through the lower boundary, signaling the resumption of the downtrend that began three months ago. However, much will depend on macroeconomic and fundamental developments.

It will be difficult to anticipate any specific movement from the pair on Wednesday. The FOMC meeting is scheduled for the evening, so the price will likely remain within the sideways channel during the day.

On the 5-minute timeframe, the levels of 1.0269-1.0277, 1.0334-1.0359, 1.0433-1.0451, 1.0526, 1.0596, 1.0678, 1.0726-1.0733, 1.0797-1.0804, 1.0845-1.0851, and 1.0888-1.0896 should be considered. On Wednesday, the European Union will release its second inflation estimate for November, a minor event. There are a few minor reports in the US, the Fed meeting with Powell's speech, and an updated dot-plot chart.

Core Trading System Rules:

  1. Signal Strength: The shorter the time it takes for a signal to form (a rebound or breakout), the stronger the signal.
  2. False Signals: If two or more trades near a level result in false signals, subsequent signals from that level should be ignored.
  3. Flat Markets: In flat conditions, pairs may generate many false signals or none at all. It's better to stop trading at the first signs of a flat market.
  4. Trading Hours: Open trades between the start of the European session and the middle of the US session, then manually close all trades.
  5. MACD Signals: On the hourly timeframe, trade MACD signals only during periods of good volatility and a clear trend confirmed by trendlines or trend channels.
  6. Close Levels: If two levels are too close (5–20 pips apart), treat them as a support or resistance zone.
  7. Stop Loss: Set a Stop Loss to breakeven after the price moves 15 pips in the desired direction.

Key Chart Elements:

Support and Resistance Levels: These are target levels for opening or closing positions and can also serve as points for placing Take Profit orders.

Red Lines: Channels or trendlines indicating the current trend and the preferred direction for trading.

MACD Indicator (14,22,3): A histogram and signal line used as a supplementary source of trading signals.

Important Events and Reports: Found in the economic calendar, these can heavily influence price movements. Exercise caution or exit the market during their release to avoid sharp reversals.

Forex trading beginners should remember that not every trade will be profitable. Developing a clear strategy and practicing proper money management are essential for long-term trading success.

Paolo Greco,
Especialista em análise na InstaForex
© 2007-2024
Selecionar intervalo de tempo
5
min
15
min
30
min
1
hora
4
horas
1
dia
1
s.
Ganhe com as variações das taxas das criptomoedas com a InstaForex.
Baixe o MetaTrader 4 e abra a sua primeira operação.
  • Grand Choice
    Contest by
    InstaForex
    InstaForex always strives to help you
    fulfill your biggest dreams.
    PARTICIPE DO CONCURSO

Recommended Stories

Como negociar o par GBP/USD em 19 de dezembro? Dicas simples e análise de negociação para iniciantes

Análise das negociações de quarta-feira Gráfico 1H do GBP/USD Na quarta-feira, o par GBP/USD registrou uma queda acentuada devido ao aumento repentino do sentimento hawkish na Reserva Federal. Conforme mencionado

Paolo Greco 13:52 2024-12-19 UTC+2

EUR/USD: 18 de dezembro - Plano de negociação para a sessão dos E.U. (Análise das negociações da manhã). A inflação da zona do euro continua a cair

Em minha previsão da manhã, destaquei o nível 1,0506 como um ponto-chave de decisão para a entrada no mercado. Vamos dar uma olhada no gráfico de 5 minutos para entender

Miroslaw Bawulski 21:00 2024-12-18 UTC+2

GBP/USD: Plano de Negociação para a Sessão dos E.U. de 18 de dezembro (Revisão das Negociações da Manhã). A libra sobe após o aumento da inflação

Em minha previsão matinal, destaquei 1,2695 como um nível-chave para decisões de entrada no mercado. Vamos analisar o gráfico de 5 minutos para entender o resultado. Embora tenha ocorrido

Miroslaw Bawulski 20:47 2024-12-18 UTC+2

Como negociar o par GBP/USD em 18 de dezembro? Dicas simples e análise de negociação para iniciantes

Análise das negociações de terça-feira Gráfico de 1H do GBP/USD O par GBP/USD continuou seu movimento de alta na terça-feira, iniciado na segunda-feira. Ontem, o mercado teve motivos válidos para

Paolo Greco 14:53 2024-12-18 UTC+2

EUR/USD: Plano de negociação para a sessão dos E.U.A. de 17 de dezembro (análise das negociações da manhã)

Na minha previsão para a manhã, observei o nível de 1,0506 e planejei tomar decisões de negociação a partir daí. Vamos dar uma olhada no gráfico de 5 minutos

Miroslaw Bawulski 21:18 2024-12-17 UTC+2

GBP/USD: Plano de negociação para a sessão dos E.U.A de 17 de dezembro (análise das negociações da manhã). A libra subiu após dados do mercado de trabalho

Na minha previsão da manhã, fiquei atento ao nível de 1,2665 e planejei tomar decisões de negociação a partir daí. Vamos dar uma olhada no gráfico de 5 minutos

Miroslaw Bawulski 19:08 2024-12-17 UTC+2

GBP/USD: Plano para a sessão dos E.U.A. de 11 de dezembro (Análise das negociações da manhã). Pressão sobre o retorno da libra

Na minha previsão da manhã, foquei no nível 1,2758 e planejei tomar decisões de negociação com base nele. Vamos dar uma olhada no gráfico de 5 minutos e analisar

Miroslaw Bawulski 19:29 2024-12-11 UTC+2

EUR/USD: 5 de dezembro - Plano de negociação para a sessão dos E.U.A. (Análise da negociação da manhã)

Em minha previsão da manhã, identifiquei o nível 1,0543 como uma área-chave para decisões de entrada no mercado. Uma análise do gráfico de 5 minutos mostra que um aumento

Miroslaw Bawulski 19:33 2024-12-05 UTC+2

GBP/USD: Plano de negociação para a sessão dos E.U.A de 5 de dezembro (análise da negociação da manhã). A libra se aproximou de 1,2740

Em minha previsão da manhã, identifiquei o nível 1,2718 como uma área-chave para decisões de entrada no mercado. Uma análise do gráfico de 5 minutos revela que um aumento

Miroslaw Bawulski 19:01 2024-12-05 UTC+2

Como negociar o par EUR/USD em 4 de dezembro? Dicas simples e análise de negociação para iniciantes

Análise das negociações de terça-feira Gráfico 1H do EUR/USD Na terça-feira, o par EUR/USD continuou negociando dentro de um canal horizontal. Embora o movimento lateral não tenha sido tão evidente

Paolo Greco 16:22 2024-12-04 UTC+2
Não pode falar agora?
Faça sua pergunta no chat.
Widget callback
 

Dear visitor,

Your IP address shows that you are currently located in the USA. If you are a resident of the United States, you are prohibited from using the services of InstaFintech Group including online trading, online transfers, deposit/withdrawal of funds, etc.

If you think you are seeing this message by mistake and your location is not the US, kindly proceed to the website. Otherwise, you must leave the website in order to comply with government restrictions.

Why does your IP address show your location as the USA?

  • - you are using a VPN provided by a hosting company based in the United States;
  • - your IP does not have proper WHOIS records;
  • - an error occurred in the WHOIS geolocation database.

Please confirm whether you are a US resident or not by clicking the relevant button below. If you choose the wrong option, being a US resident, you will not be able to open an account with InstaForex anyway.

We are sorry for any inconvenience caused by this message.